DATA ACQUISITION SYSTEMS
GENERAL DAS:
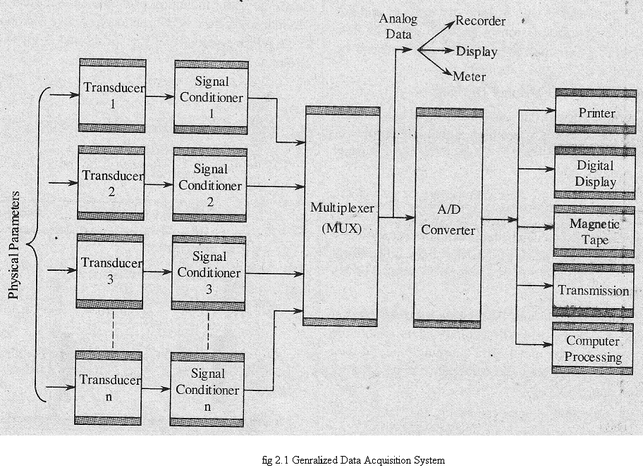
The block diagram of a general Data Acquisition System (DAS) is shown in the figure below.
It consists of the following elements.
1. Transducer
2. Signal conditioner
3. Multiplexer
4. Analog to Digital Converter
5. Recorders and Display devices
1. Transducer
A transducer is used to convert the physical parameters corning from the field into
electrical signals or it is used to measure directly the electrical quantities such as resistance,
voltage, frequency, etc.
2. Signal Conditioner
Usually the output signals of the transducer will be of very low level (weak) signals
which cannot be used for further processing. In order to make the signals strong enough to drive
the other elements signal conditioners such as amplifiers, modifiers, filters etc., are used.
3. Multiplexer
The function of the multiplexer is to accept multiple analog inputs (after signal
conditioning) and provide a single output sequentially according to the requirements.
4. A/D Converter
The analog-to-digital (A/D) converter is generally used to convert the analog
data into digital form. The digital data is used for the purpose of easy processing, transmission,
digital display and storage.
Processing involves various operations on data such as comparison,
mathematical manipulations, data is collected, converted into useful form and utilized for various
purposes like for control operation and display etc.
The transmission of data in digital form is possible over short distances as well as long distances
of and has advantages over transmission in analog form. The data can be stored permanently or
temporarily and can be displayed on a CRT or digital panel.
5. Recorders and Display Devices
In display devices the data is displayed in a suitable form in order to
monitor the input signals. Examples of display devices are oscilloscopes, numerical displays,
panel meters, etc.
In order to have either a temporary or permanent record of the useful data recorders are
used. The analog data can be recorded either graphically or on a magnetic tape. Optical
recorders, ultraviolet recorders, styles-and-ink recorders are some of its examples.
The digital data can be recorded through digital recorders. The digital data is first
converted into a suitable form for recording by means of a coupling unit and then recorded on a
magnetic tape, punched cards or a perforated paper tape.
PC-BASED DAS
· We are considering a process where temperature parameter has to be calculated.
· Measurement is done using transducers.
· The detected temperature will be given to transmitter.
· The transmitter will accept input or DC mV input and convert it into a 4 to 20 mA
signal for transmission.
· Transmitter is connected to DAS ie used to read data from temperature transmitter.
· Then a simulink model is used to interface DAS with Matlab software in PC.
· The system is developed with Matlab GUI.
· GUI will capture data from workspace and further will calculate the average of actual output and output error.
· The process will be continued by plotting five point temperature calibration and error curve.
· By implementing this system in industry, the improvement and continuity in learning process will be achieved.
